Software

 Software
RAKI
Race ǀ Analyse ǀ Knowledge ǀ Improve

The RAKI analysis software is a visualising, analysing and simulating tool for Motorsport that is meant to save time and enable smarter decision making during a race weekend.


The RAKI analysis Software is able to merge different data sources like sensor data, timing sheets and motorcycle setups. Together with analytics and machine learning techniques, this software is able to split sensor data over corner and corner segmentation. This corner segmentation increase the power of analytics and machine learning and increases the power of data analysis.

KEY FEATURES

Timesheet analysis

The timesheet analysis imports the result sheet. This data is visualized in the Timesheet analysis feature, aswell used in other analysis like the rider analysis.


The timesheet analysis calculates the difference to the overall fastest as well compared to the selected rider laps. Without additional work, this sheet gives an overview of the strengths and weaknesses on the different track sections.


The track pointer is an additional feature which shows the position on track compared with all other riders. This makes is possible to quickly see if the rider in the selected lap was inside a group of riders or on his own. 


Rider analysis

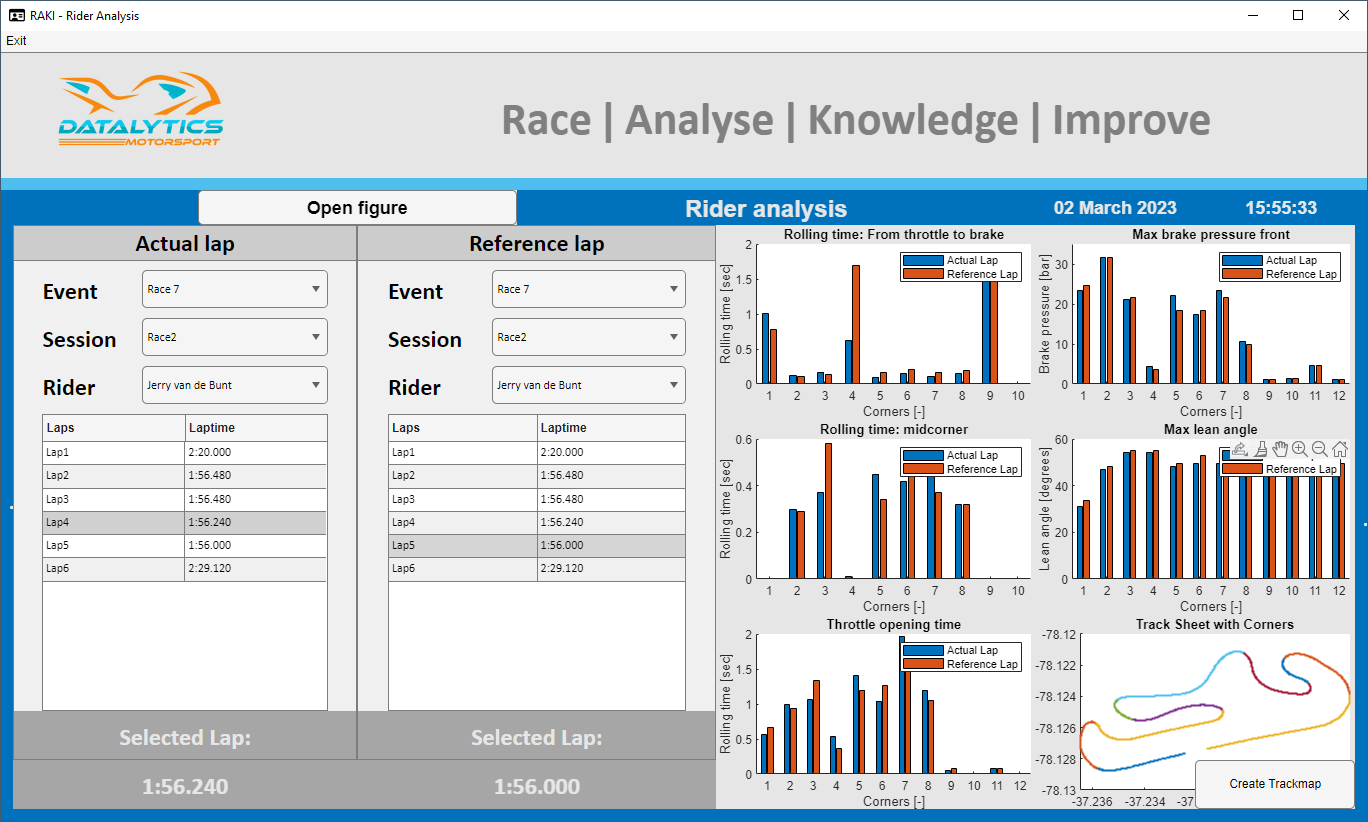
The rider analysing tool is able to visualize an analytic analysis of rider behaviour devided over different corners.


Also this tool is able to create a standarized print out for the rider. This print out contains  timeplot with rider behaviour channels like brake pressure, throttle position, lean angle, gear, speed. In comparison mode also a time difference is showed.

Gearing analysis

The gearing sheet shows the midcorner as well the maximum straight line engine speed over the different corners. This data is plotted in a bar graph.


Additionally this sheet is able to calculate the optimum gearing. The calculation takes the sensor data as input together with a selected engine speed limiter. Also a buffer is given to have a certain safety factor. 


The table on the right hand side shows the optimum gearing together with the belonging swingarm length for two different chain length possibilities. 


The simulation tab gives the possibility to simulate the selected gearing. The output is a timeplot with the old and new engine speed computet over one selected lap of data.

Suspension analysis

The suspension analysis tool gives an visualization of the statistical suspension values over all corners. The data is visualized in a bar plot for minimum, mean, maximum and mean midcorner values.


The optimization tab gives an optimum spring/preload combination. This optimum spring/preload combination is based on predefined values for maximum and midcorner strokes. The result of the predicted spring/preload combination is shown in the table on the right hand side. In the middle the suspension force is plotted.

Setup trends

The setup trend tool shows the setup direction over a full season. Data from each event are saved into a database.


This filled database gives additional information regarding rider preferences or track preferences. 

Parts wear

The parts wear tool gives the possibility to track the mileage of all sorts of parts. 


This makes service intervals more predictable and easier to manage.

Update setup sheets

Do you have your own documation of your bike setup? Are you using an Excel tool or 2D specview? 


This tool is able to update your documation automatically. All information cathered in the RAKI database could be updated into an external tool. Please ask for the possibilities. 

  • Software license

    The software is licensed with a dongle. Please ask for the possibilities.

Share by: